Summary | |
|
Online application for survival analysis (OASIS 2) is a one-stop tool for various statistical tasks involved in analyzing survival data in a user-friendly manner.
OASIS 2 provides a uniform platform that is an essential application to facilitate efficient statistical analyses of survival data in the ageing field. | |
| |
|
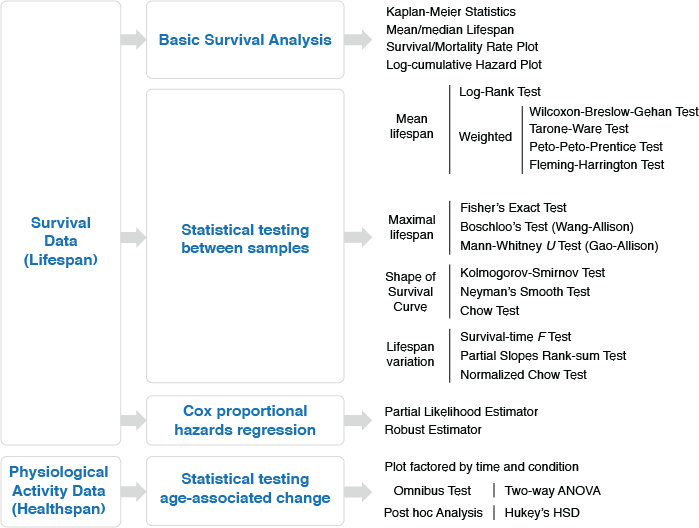
The statistical features of OASIS 2 include the calculation of Kaplan-Meier estimates, mean/median lifespan, mortality rate, Mantel-Cox Log-Rank test, Fisher's exact test, weighted Log-Rank test, Kolmogorov-Smirnov test and Neyman's smooth test.
Moreover, OASIS 2 generates survival and mortality curves that can be easily exported and modified by using common graphic softwares. | |
Download | ||
|
We provides OASIS 2 source codes for statistical analyses of survival data.
All codes are provided as open source under a GNU General Public License (GPL).
| ||
Basic Survival Analysis | ||
|
Python (higher than 2.4) and matplotlib should be properly installed.
[ Download ]
| ||
Statistical testing methods | ||
|
Python (higher than 2.4), numpy, rpy, statlib, chow test, R, and surv2sample (R package) should be properly installed.
[ Download ]
| ||
Cox proportional hazards regression | ||
|
Python (higher than 2.4), rpy, R, and coxrobust (R package) should be properly installed.
[ Download ]
| ||
Basic survival analysis | |||||
Input Format | |||||
 | |||||
|
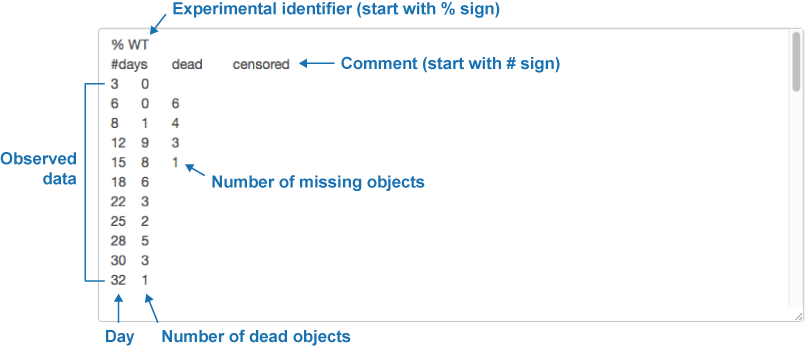
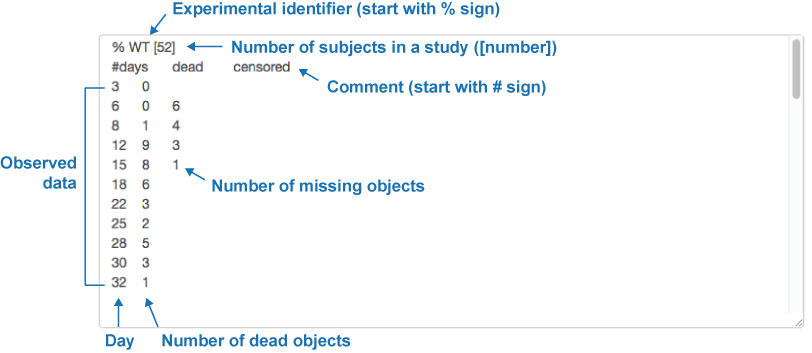
As shown in above figure, OASIS 2 takes following format of input data for basic analysis and statistical testing between samples. The data should be tab-delimited.
You can download example files : example1, example2 | |||||
| |||||
|
% Condition Identifier (Required) [Total number of subjects] (Optional)
# Comment (Optional) Survival Data (Required, The data should be Tab-Delimited)
| |||||
Output Format | |||||
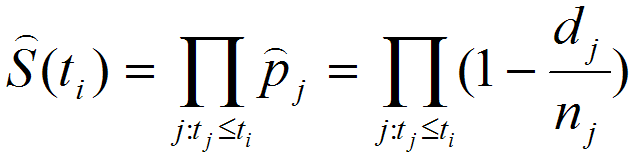
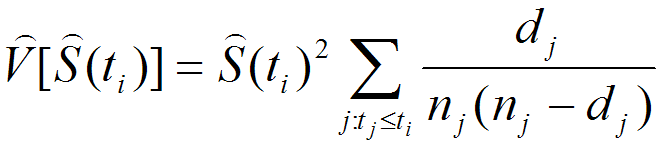
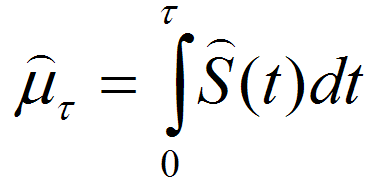
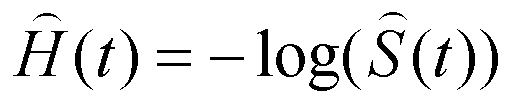
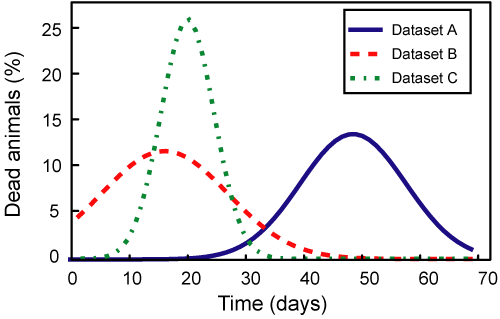
In basic survival analysis, OASIS 2 provides several survival statistics such as Kaplan-Meier estimator, Mean/Median lifespan, Survival curve and Mortality curves which can help to user interpret their survival data.
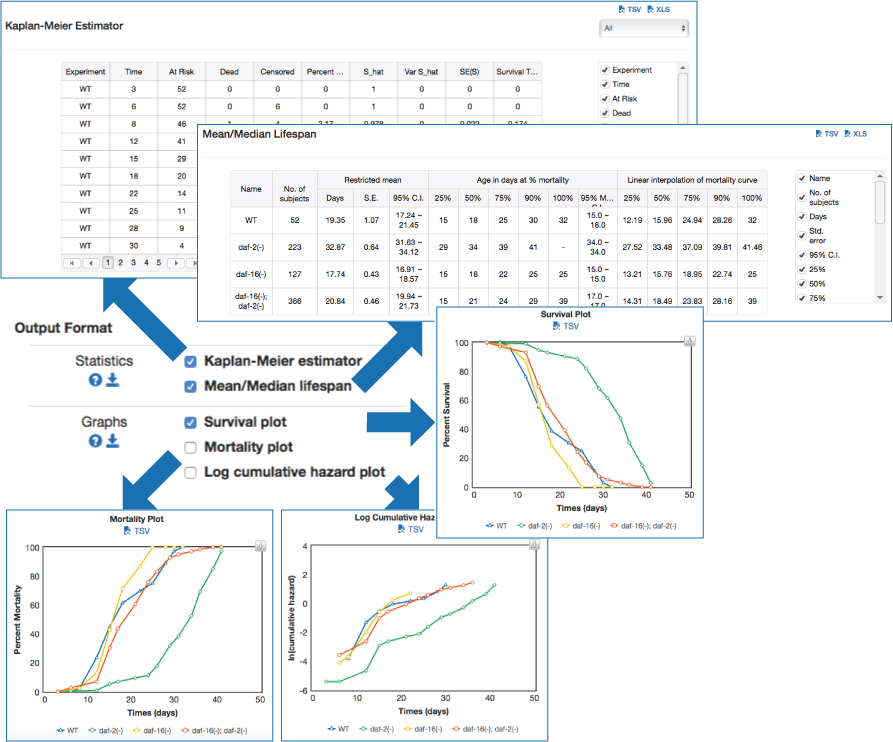
| Statistics for the estimation of observed survivalIn ageing research, a description of survival data such as the estimation of mean lifespan is essential for determining the effects of a drug treatment or genetic manipulation on ageing. Thus, one of the primary objectives of survival analysis is the estimation of survival function from incomplete datasets. To estimate survival time as the area under the survival curve, it is necessary to characterize the survival function which is a probability of death after some specific time t. | ||||
Statistical testing between samples | ||
Input Format | ||
| Input Format for statistical testing is same as that of basic survival analysis | ||
Ouput Format | ||
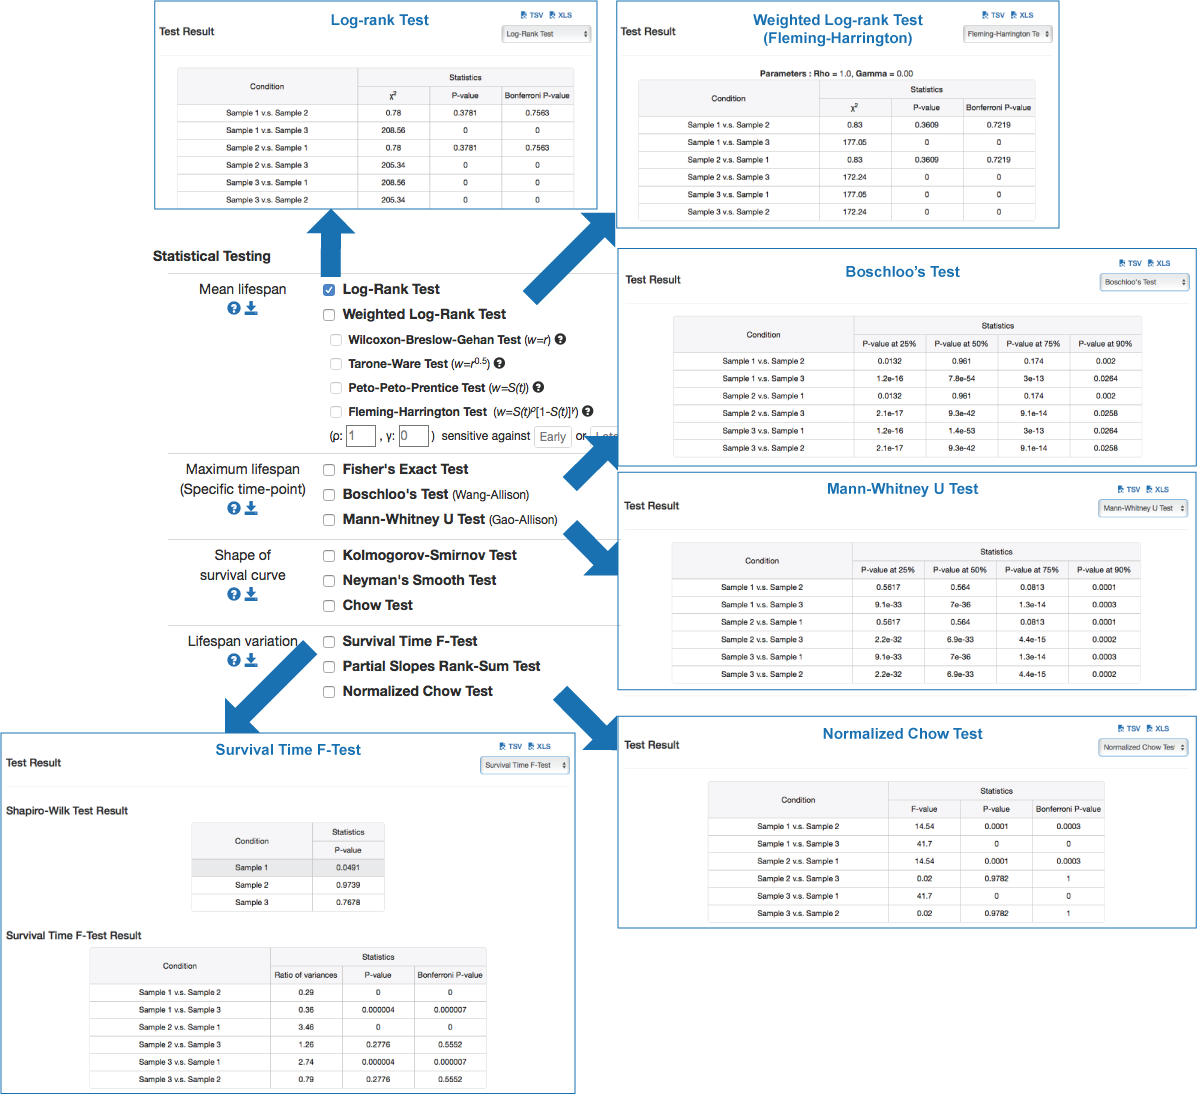 | ||
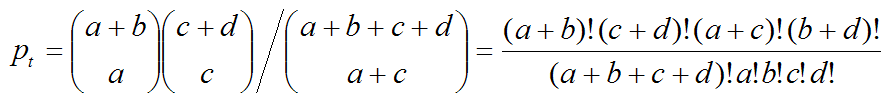
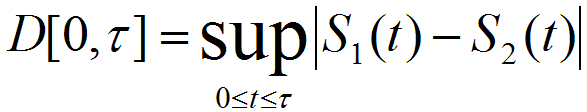
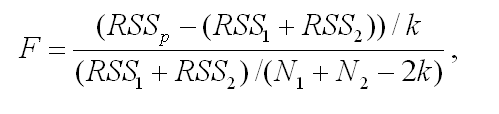
Test for the significance of difference in lifespanIn a lifespan study, the comparisons of survival functions between experiment and control groups are important to determine the efficacy of the experimental treatments such as genetic manipulation, dietary intervention, or drug treatments. To systematically compare survival functions between experiment and control, we need to check various statistics in survival datasets because different conditions may increase or decrease lifespan in different ways. For example, some conditions could only increase the average lifespan, whereas others could increase both of average and maximum lifespan. Therefore, the statistics of overall lifespan is compared using log-rank test, whilst those of a specific time point is compared with Fisher's exact test. Based on comparisons of various statistics with overall lifespan, we can infer which condition reduces mortality caused by mid-life diseases or slow down fundamental processes of ageing.
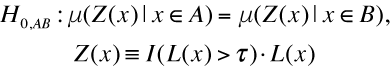
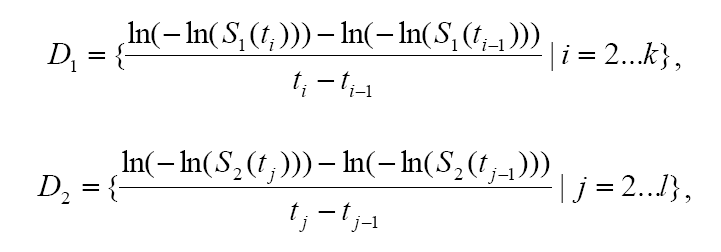
Maximal Lifespan comparisonOASIS 2 has a new feature for proper quantification of differences in maximal lifespan between datasets. Maximal lifespan is an upper percentiles of the distribution of lifespan, which contrasts with mean lifespan. Maximal lifespan could be determined by "fundamental process of aging" whereas mean lifespan changes with various condition such as diseases. This is of interest because increasing maximal lifespan may be an indicator that an intervention is slowing the general processes of aging and not merely retarding the development of specific diseases. Thus, it could be useful to detect differences in maximal lifespan as opposed to simply “curve squaring” that can be induced by increasing mean or median lifespan without increasing maximal lifespan.

| ||
Cox proportional hazards regression | ||
Input Format | ||
 | ||
|
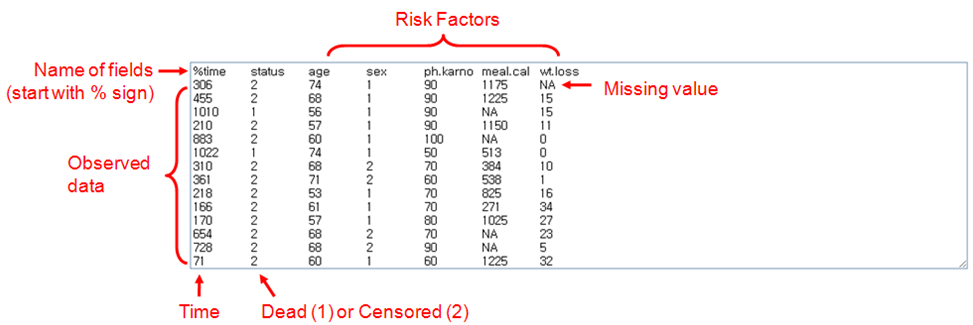
OASIS 2 takes following format of input data for Cox proportional hazards regression. | ||
|
% Name of fields (Required) Survival Data (Required, The data should be Tab-Delimited)
| ||
Ouput Format | ||
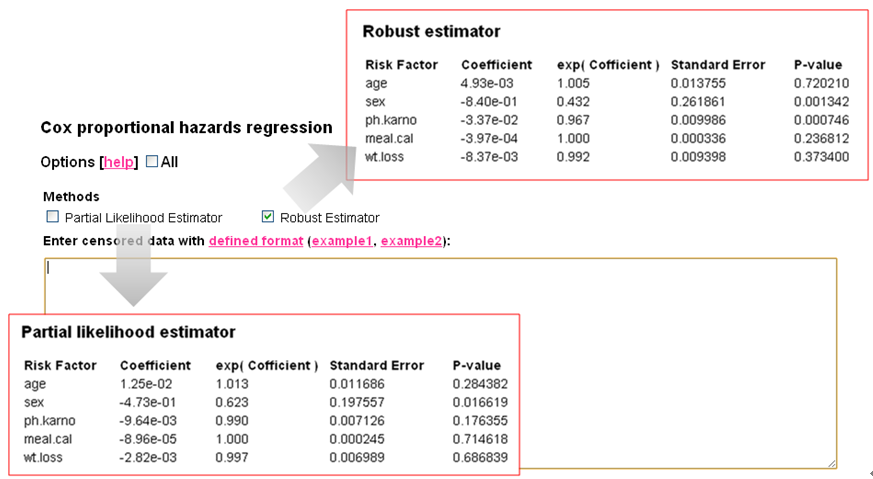 | ||
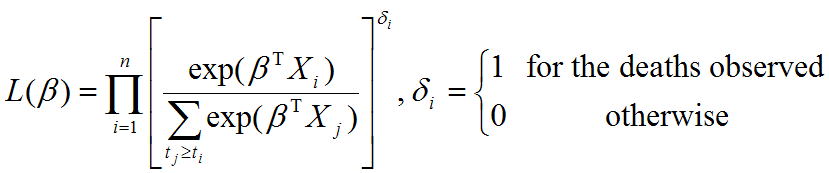
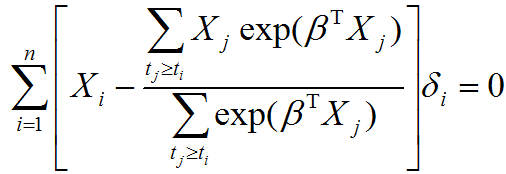
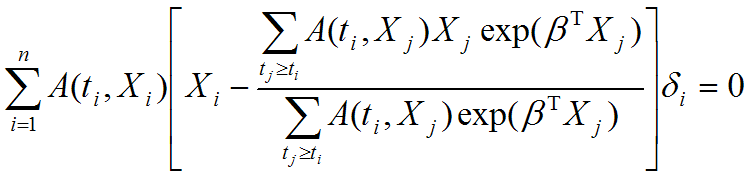
Evaluating the effect of several risk factorsOASIS 2 provides Cox proportional hazards regression which can evaluate the effect of several risk factors such as sex, age, and weight on survival on survival. By considering that hazardwhere
| ||
References
| Description | Reference | Url |
| Kaplan-Meier Estimator | - | http://en.wikipedia.org/wiki/Kaplan-Meier_estimator |
| Survival Function | - | http://en.wikipedia.org/wiki/Survival_function |
| Examples | - | http://www.weibull.com/LifeDataWeb/nonparametric_analysis.htm |
| Examples | - | http://www.statsdirect.com/help/survival_analysis/kaplan.htm |
| Wilcoxon signed-rank test | - | http://faculty.vassar.edu/lowry/wilcoxon.html |
| Wilcoxon rank sum test | - | http://elegans.swmed.edu/~leon/stats/utest.html |
| Maximal lifespan | - | https://en.wikipedia.org/wiki/Maximum_life_span |
| Maximal lifespan | Wang et al., 2004 | http://www.sciencedirect.com/science/article/pii/S0047637404001496 |
| Boschloo's test | - | https://cran.r-project.org/web/packages/Exact/Exact.pdf |
| Boschloo's test | - | http://oai.cwi.nl/oai/asset/8128/8128A.pdf |
| Modified Mann-Whitney U Test | Gao et al., 2008 | https://bmcmedresmethodol.biomedcentral.com/articles/10.1186/1471-2288-8-49 |
| Fisher's exact test | - | http://www.socr.ucla.edu/htmls/ana/FishersExactTest_Analysis.html |
| Fisher's exact test | - | http://faculty.vassar.edu/lowry/fisher.html |
| Fisher's exact test | - | http://www.langsrud.com/fisher.htm |
| Log Rank Test | - | http://bioinf.wehi.edu.au/software/russell/logrank/index.html |
| Kaplan-Meier survival function | - | http://www.hutchon.net/Kaplan-Meier.htm |
| SURVSOFT | Geiss K et al.,2009 | http://www.krebsregister-bayern.de/software_e.html |
| surv2sample | Kraus D, 2007 | http://www.davidkraus.net/surv2sample/ |
| coxrobust | Bednarski T et al., 2006 | http://cran.r-project.org/web/packages/coxrobust/index.html |
| Chow test | Dr. Ernesto P. Adorio | http://adorio-research.org/wordpress/?p=1789 |
| Weighted log-rank test | - | http://www.stata.com/manuals13/stststest.pdf |
Promislow DEL, Tatar M, Pletcher SD, Carey JR (1999) Below-threshold mortality: implications for studies in evolution, ecology and demography. J. Evol. Biol. 12, 314-328.
|
Structural Bioinformatics Lab. |