Age-adjusted machine learning to identify microbes associated with skin quality in Korean skin microbiome data.
Please use Park et al. Age-adjusted machine learning to identify microbes associated with skin quality in Korean skin microbiome data. Microbiome. (2026) to cite our data.Search microbe in your interest to predict skin quality effects.
Webpage Tutorial |
Microbe
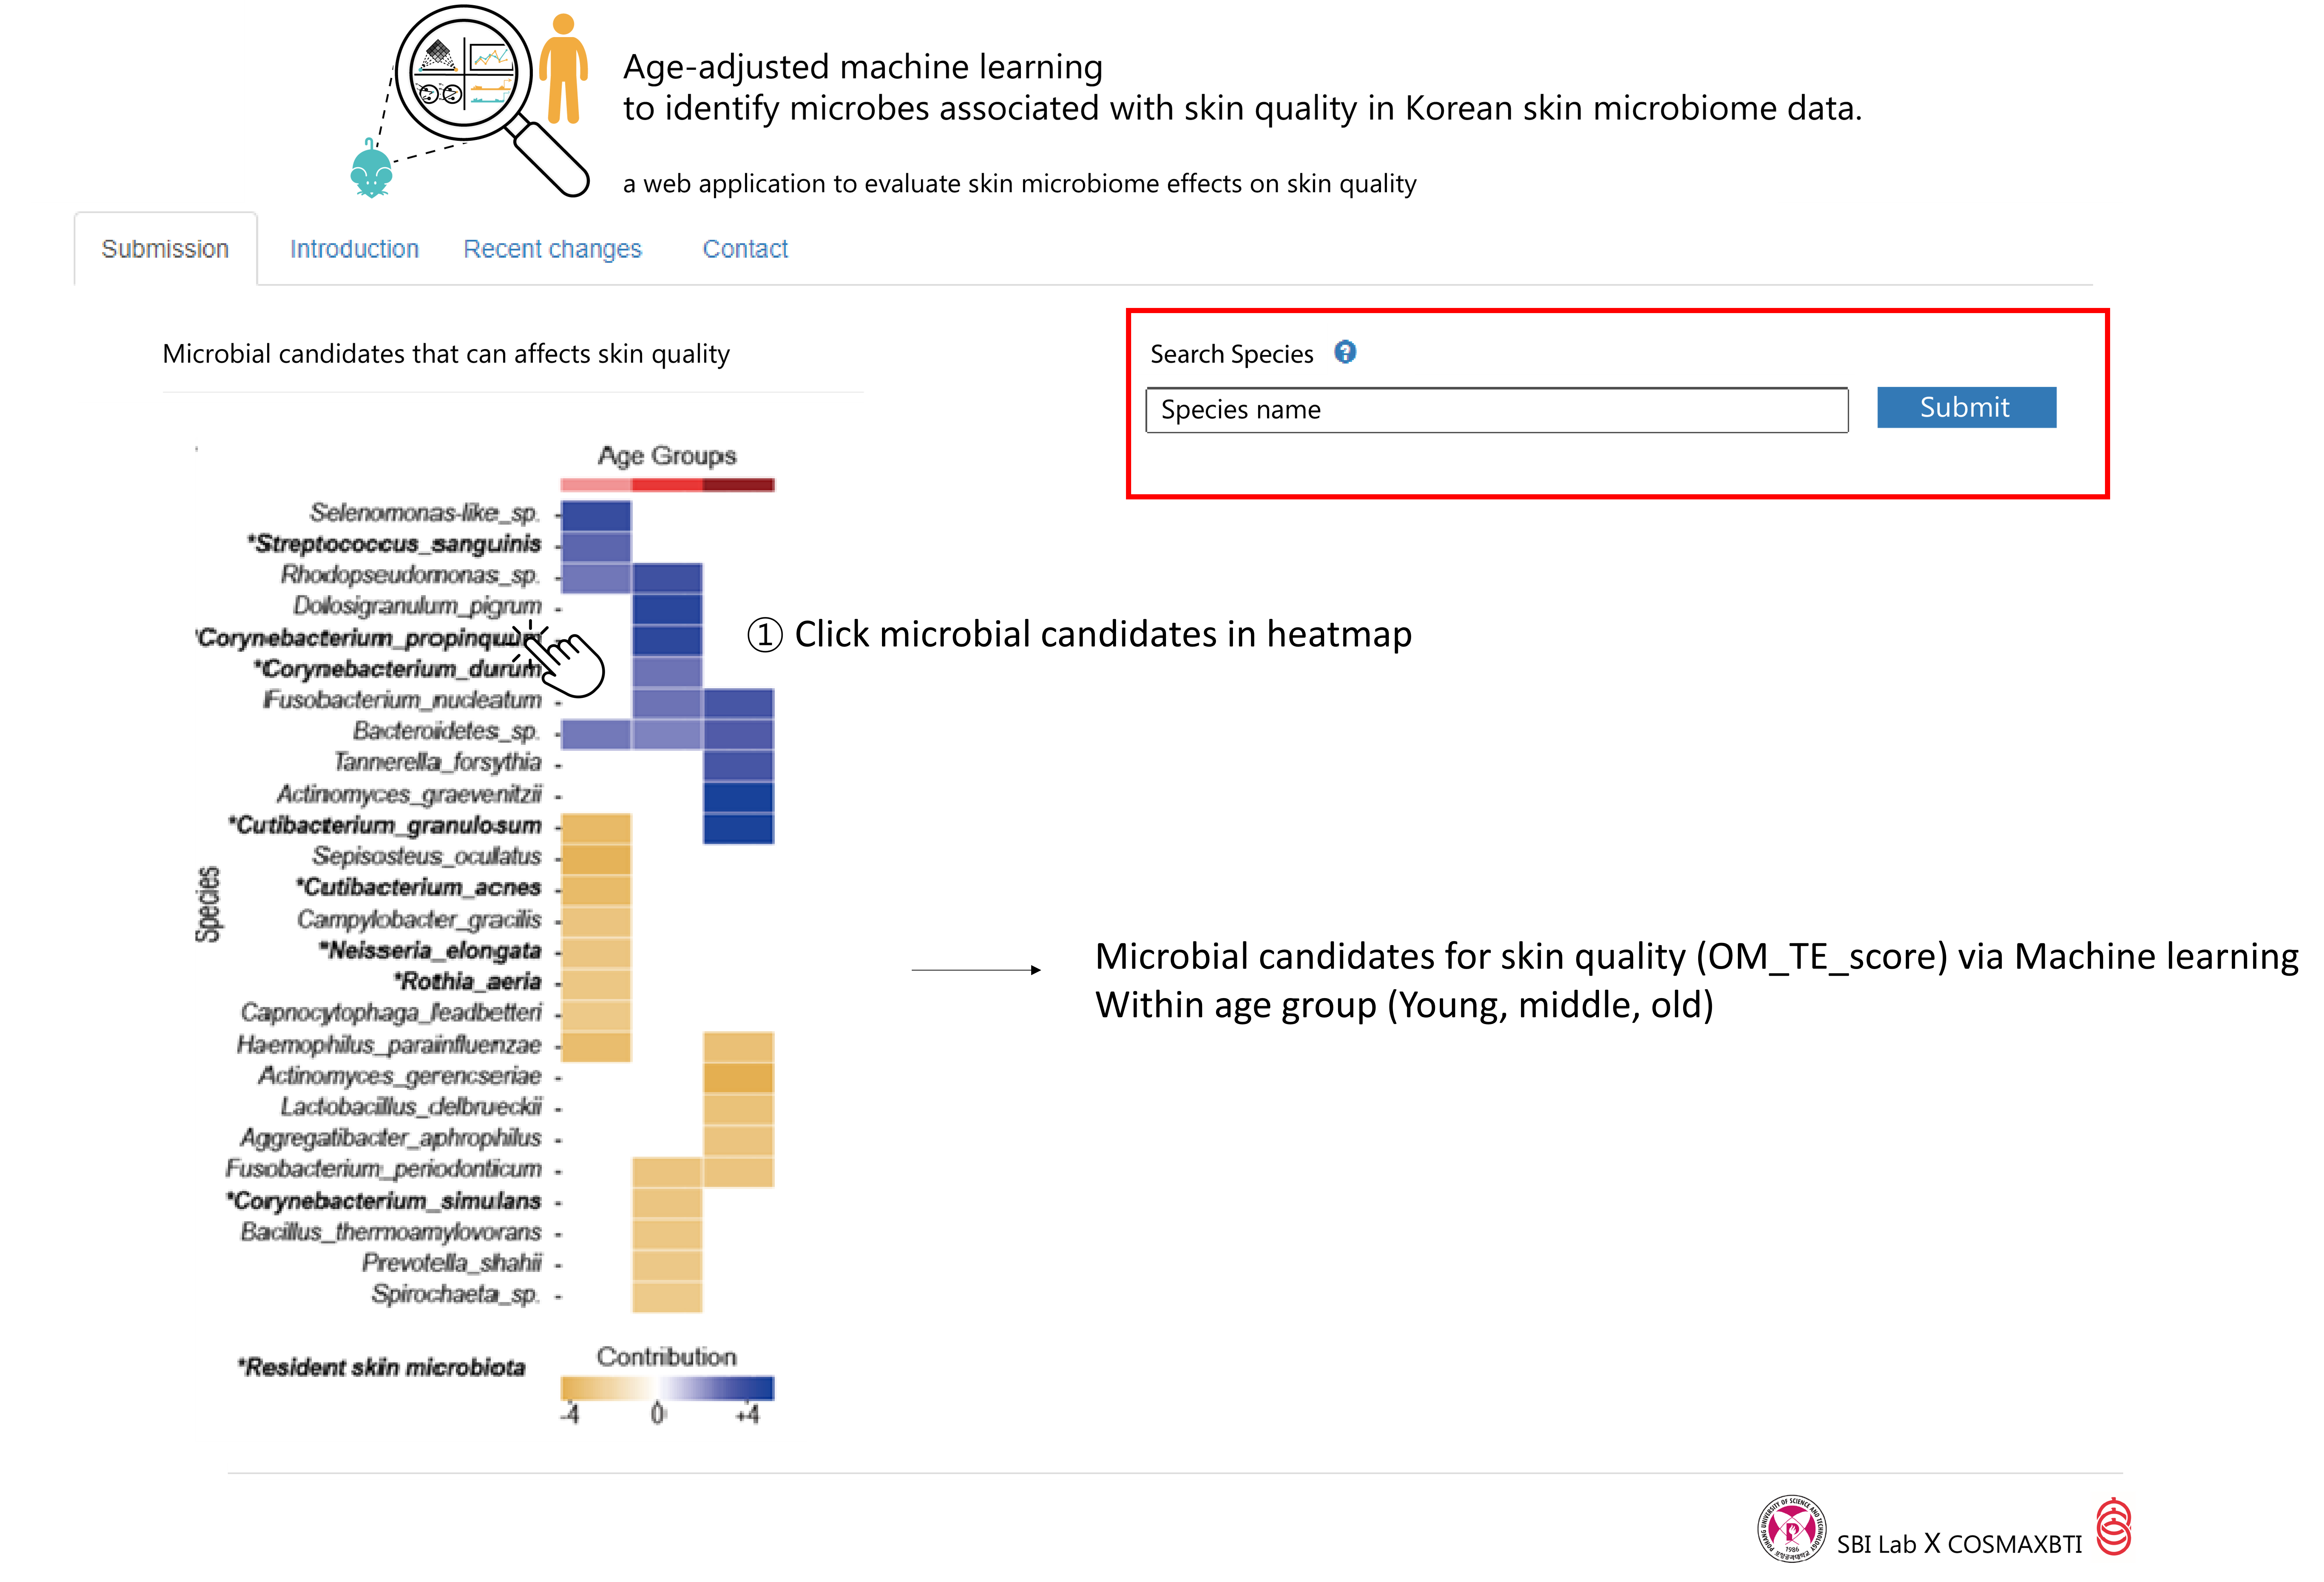
This page presents the skin microbial associations for four major skin measurements — moisturizing, sebum production, skin tone, and elasticity — across each age group and the entire dataset.
You can either type a microbial species name or click on the species heatmap, which displays microbial candidates identified by our age-adjusted machine learning model.
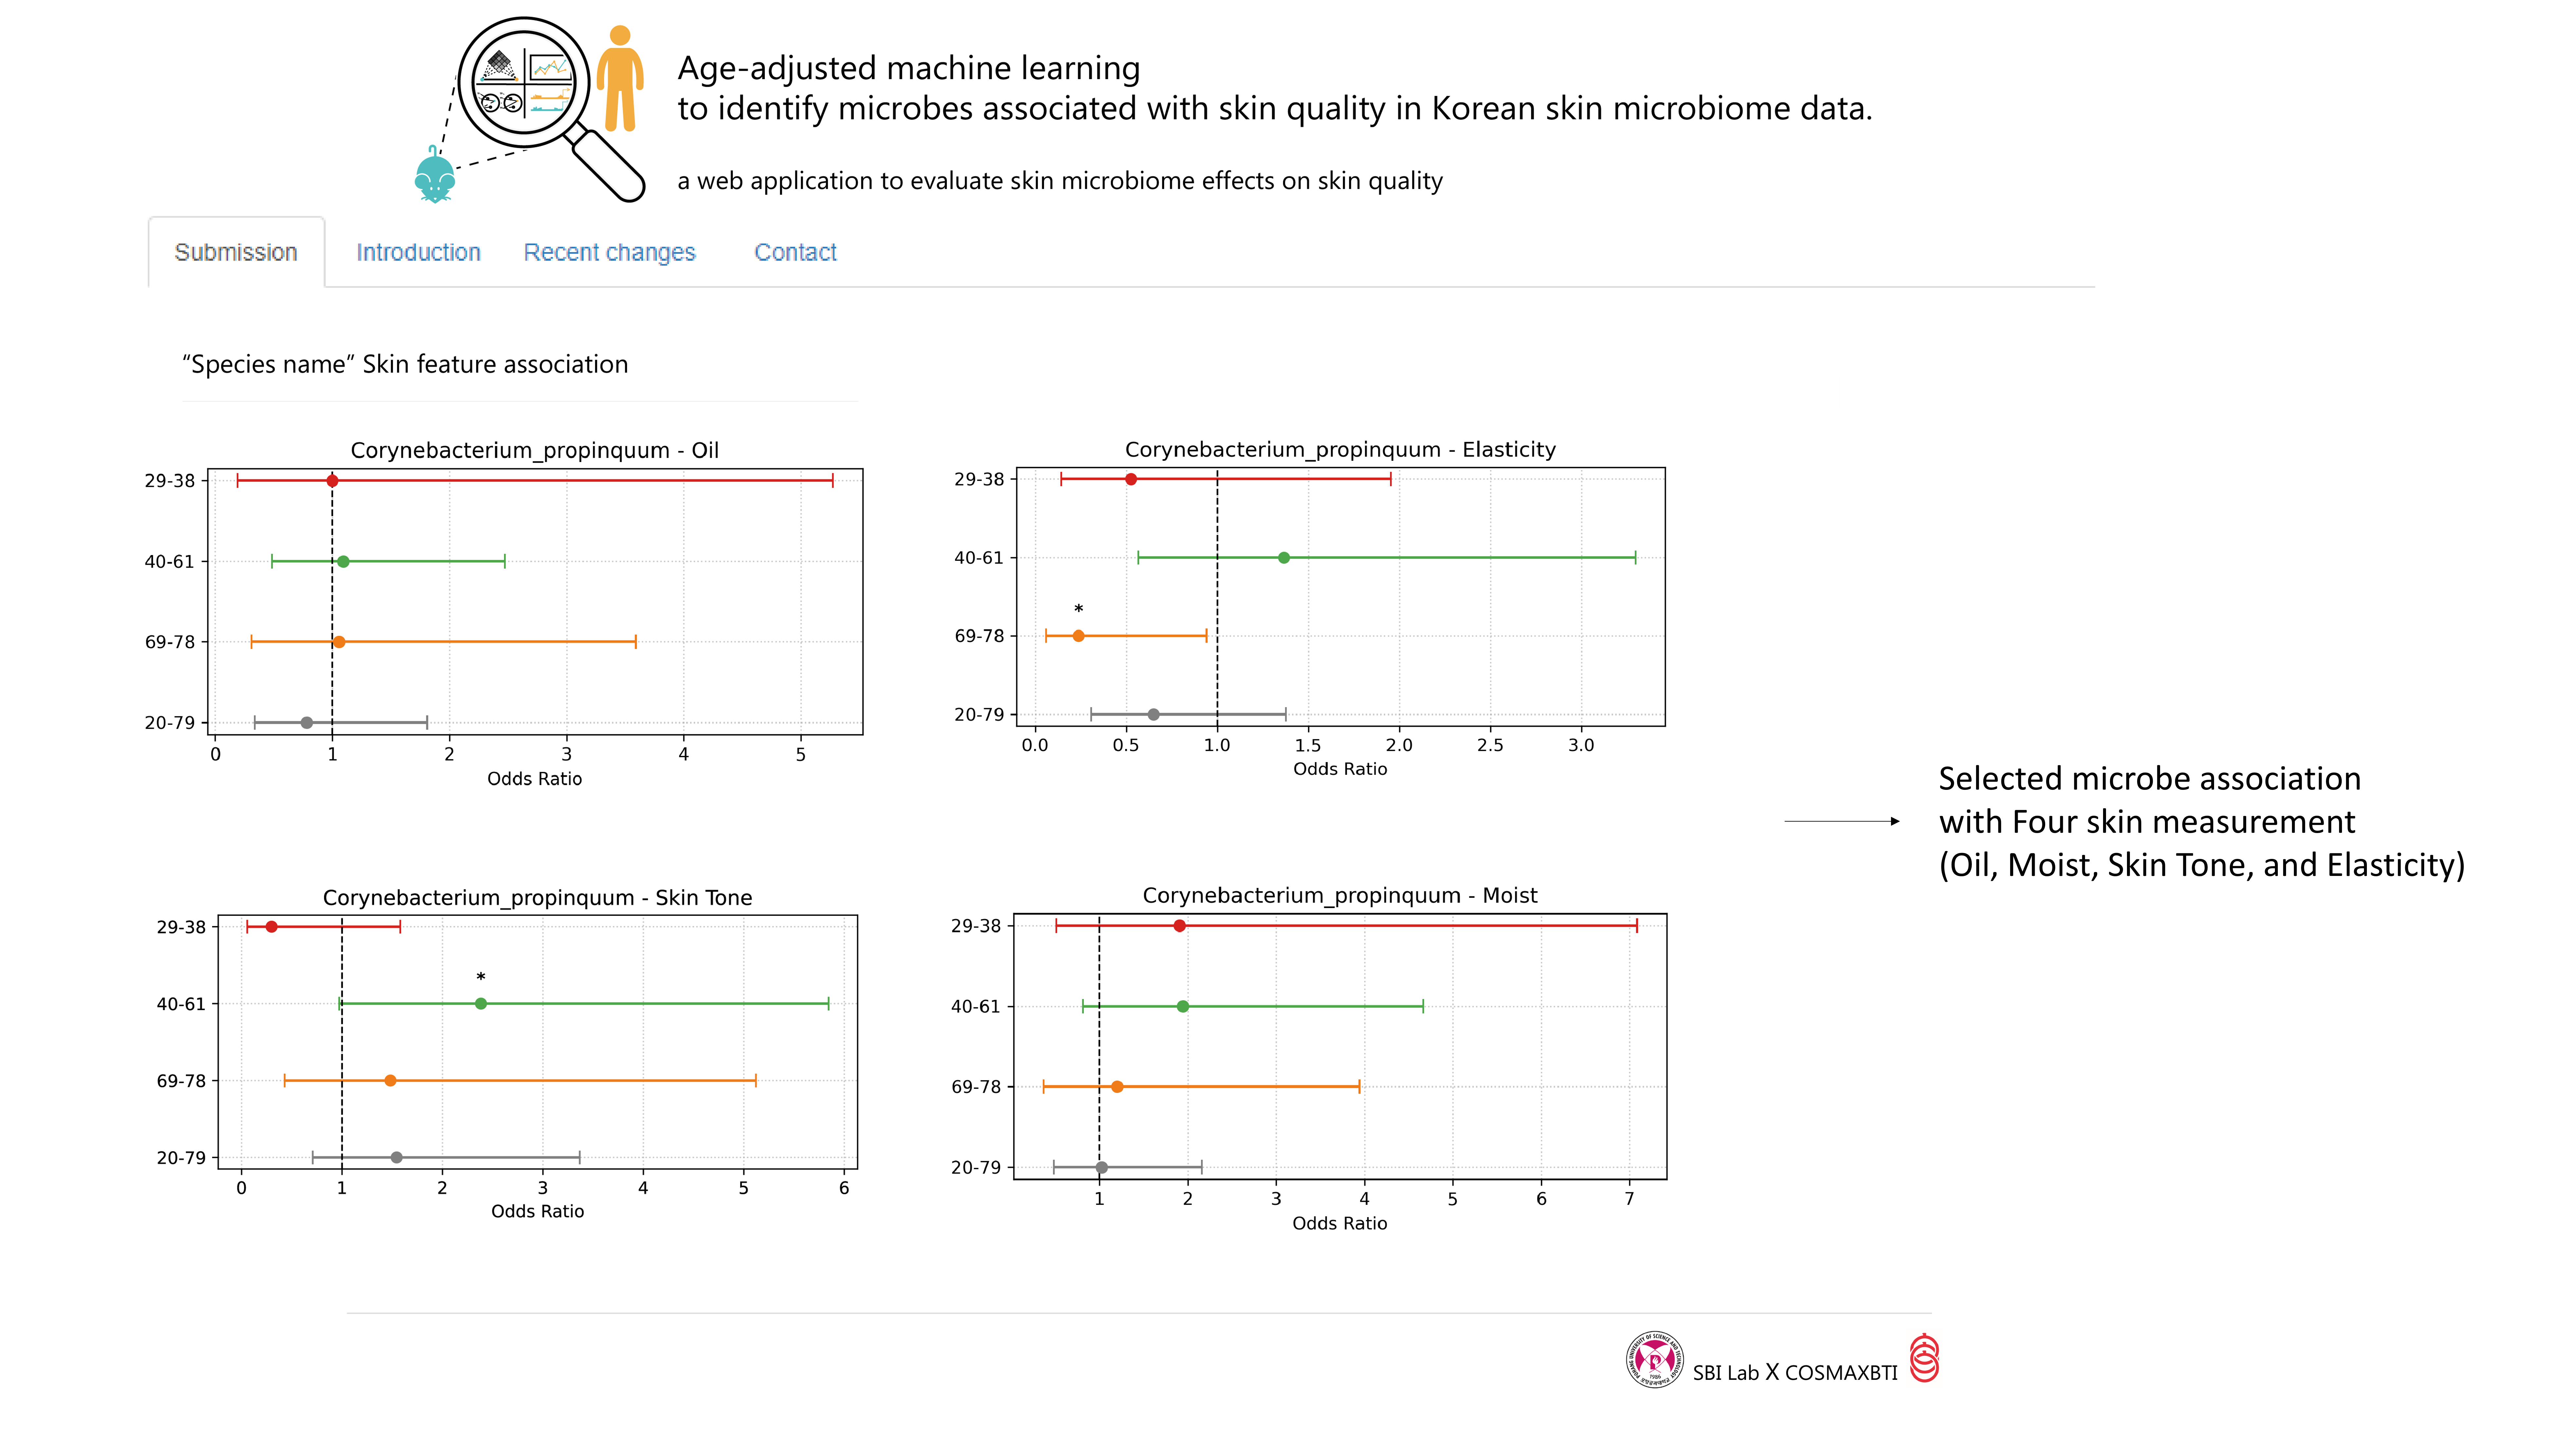
The resulting page will show the odds ratio representing each microbe’s association with the four skin measurements within each age group and across all ages.
How to interpret the forest plot:
• Odds Ratio > 1 → Improved association with skin measurement
• Odds Ratio < 1 → Deteriorated association with skin measurement
• *: p-value < 0.05, **: p-value < 0.01, ***: p-value < 0.001
• No mark → Not statistically significant
Metabolite
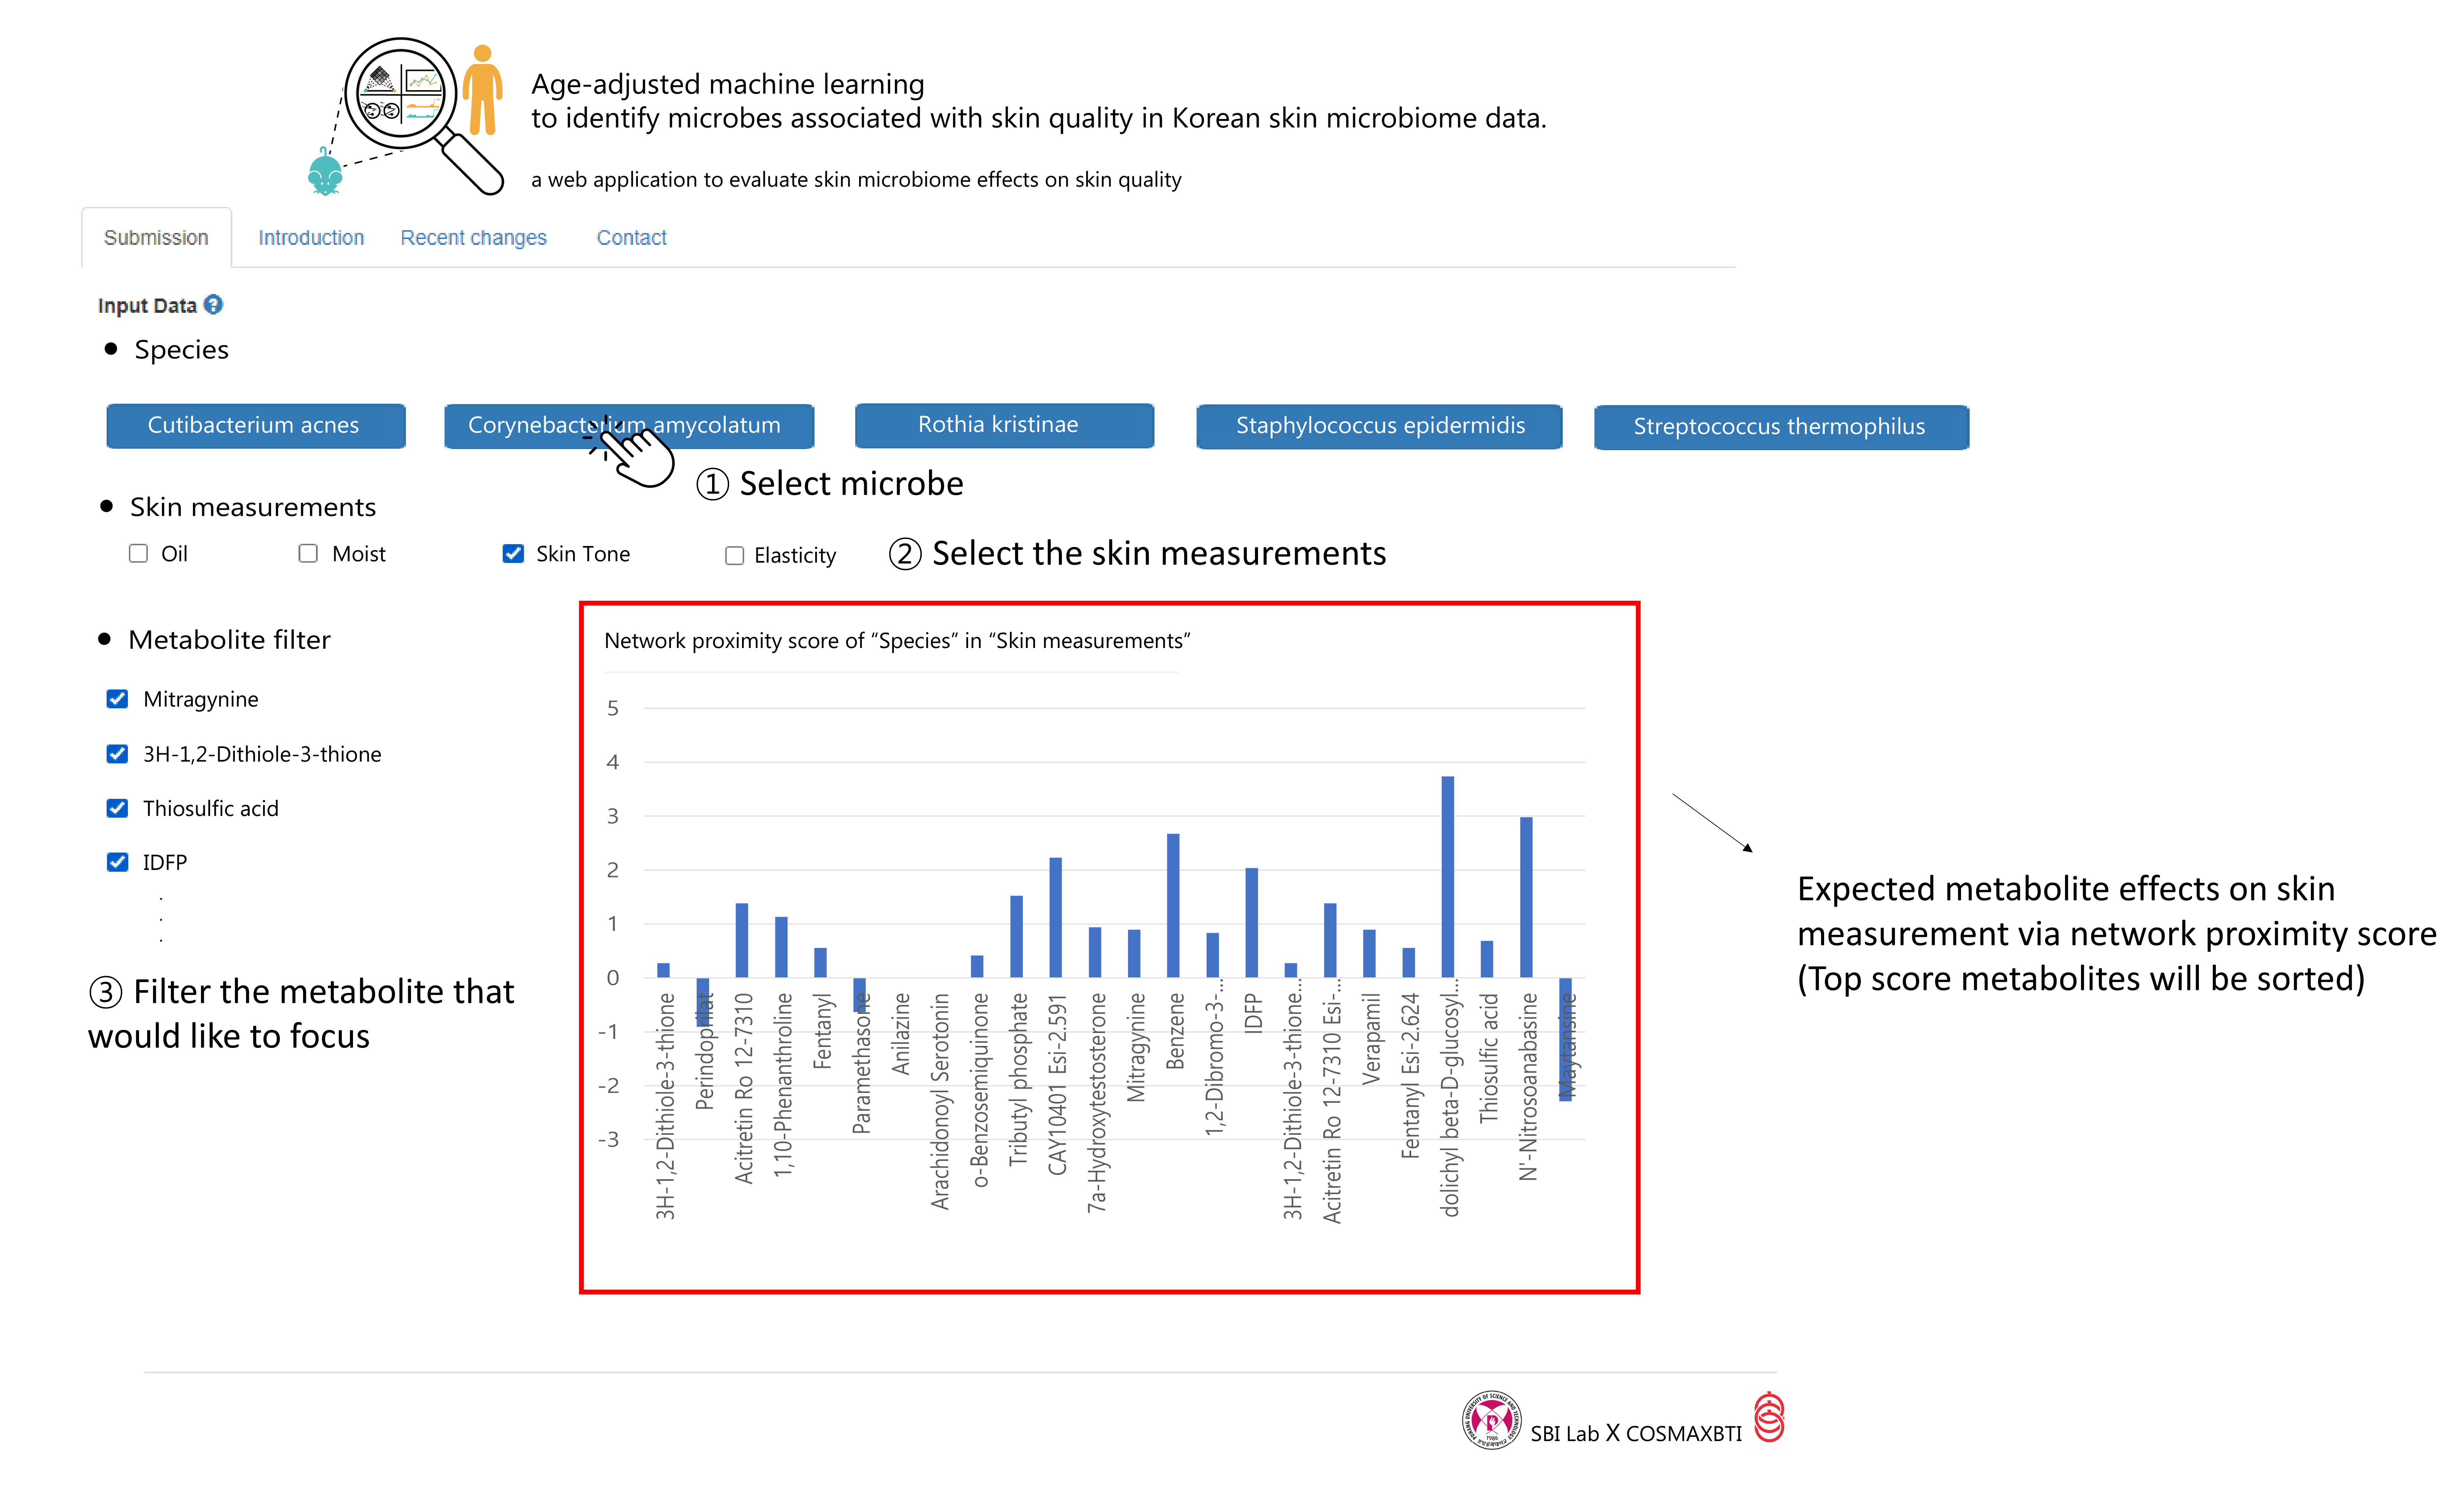
This page provides the metabolite proximity score, which quantifies the relationship between metabolites and the four major skin measurements (moisturizing, sebum production, skin tone, and elasticity). You can select a microbe and a skin measurement to view the proximity scores derived from LC-qTOF metabolomic experiments. A positive proximity score indicates a stronger association with the selected skin measurement, while a negative score indicates a weaker association (represented as the negative z-score of network proximity).
Structural Bioinformatics Lab X COSMAXBTI